Capture Attention Instantly

In the fast-scrolling world of social media, the animated charts grab viewers' attention, making them pause and engage.

More Details »

Designed for Sharing

Easily embeddable and shareable across all major platforms – from Twitter to LinkedIn, Instagram to Facebook.

More Details »

Branding Consistency

Customize animations to align perfectly with your fund’s branding and aesthetic.

More Details »

Narrate a Story

Instead of just numbers, our animations bring out the story of your fund's performance, growth, and prospects.

More Details »

Animated Line Chart

Animated Line Charts: A Dynamic Way to Visualize Trends

Dive into a fluid representation of data with our animated line charts. Unlike static visuals, these dynamic charts allow viewers to see the ebb and flow of trends over time, making it easier to grasp the intricacies of market changes, performance metrics, or any evolving data set.

Experience a seamless blend of motion and data visualization, ensuring that your audience remains captivated while gaining deeper insights. An animated line chart isn't just about data; it's about telling a continuous, compelling story of change and progression.
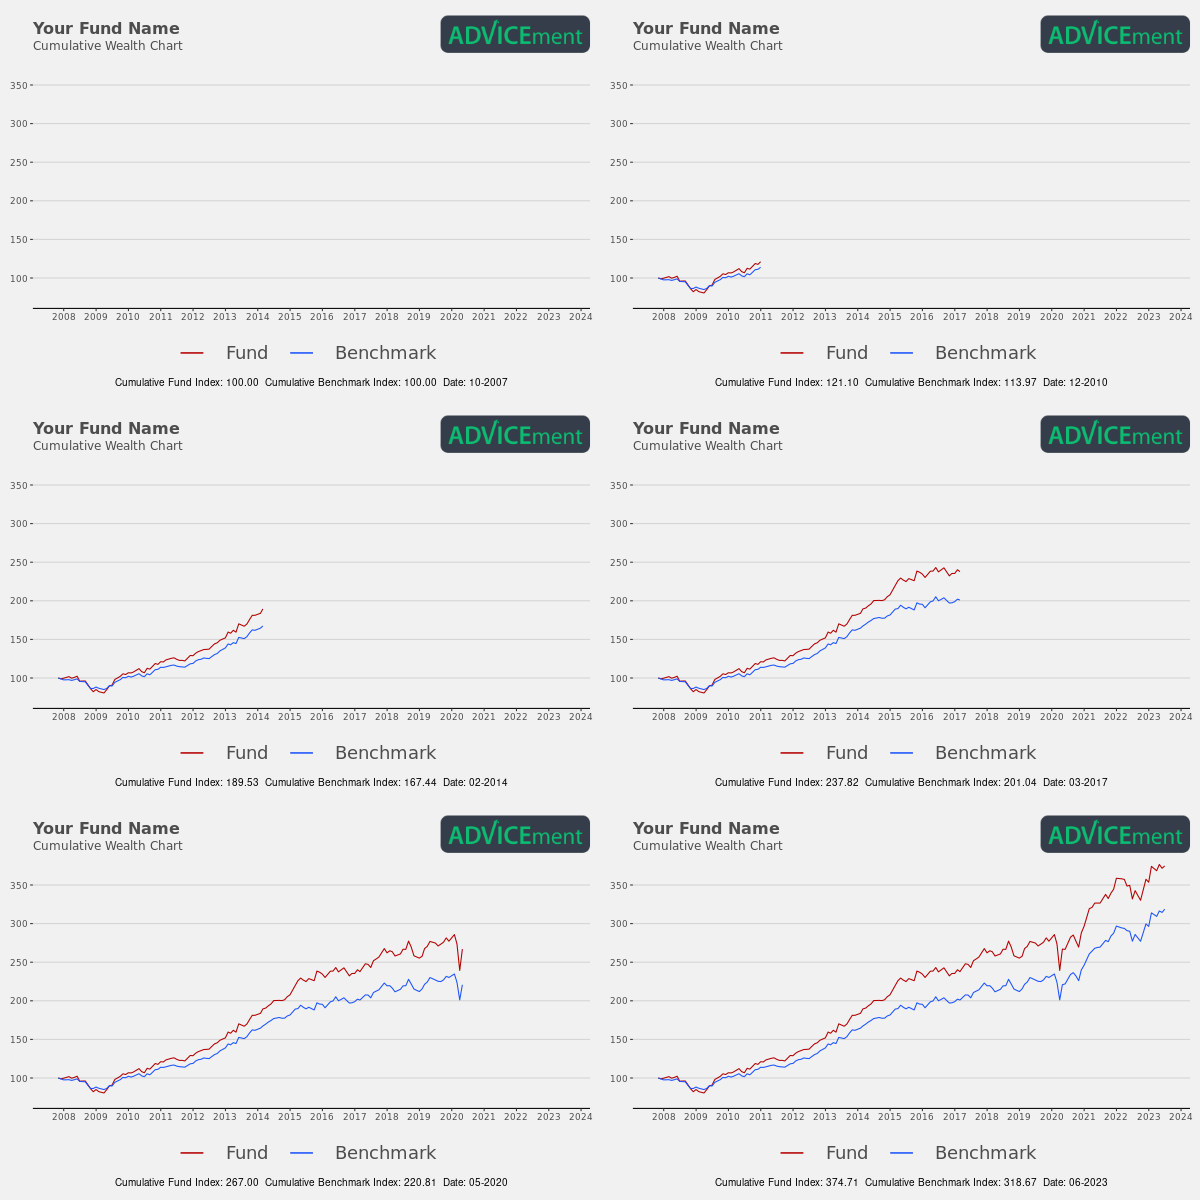
Animated Line Chart
Animated Pie Chart
Animated Pie Chart

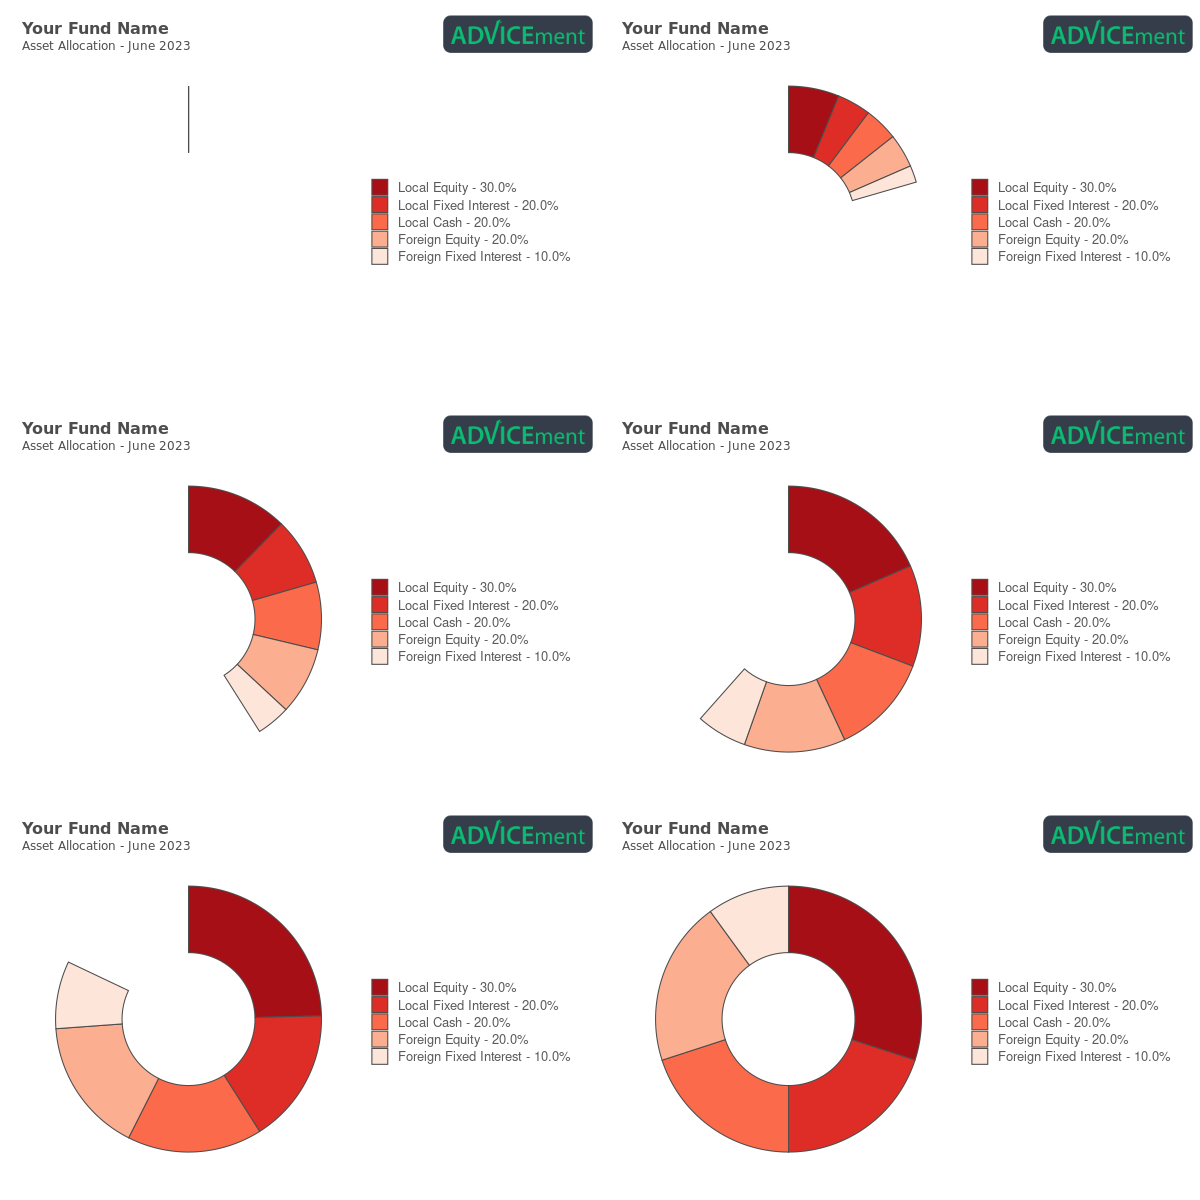
Animated Pie Charts: Asset Allocation Like Never Before

Experience the evolution of asset allocation in a captivating new light with our animated pie charts. Go beyond static visuals and immerse your audience in the dynamic world of funds, where slices of the pie grow, shrink, and shift in real-time, representing ever-changing allocations.

With these animated representations, fund managers and investors can instantly grasp the composition and balance of assets, from equities to bonds, commodities to cash. Our animated pie charts are more than just visuals; they're powerful tools that transform complex fund structures into clear, digestible, and engaging stories of financial strategy.

Animated Bar Chart

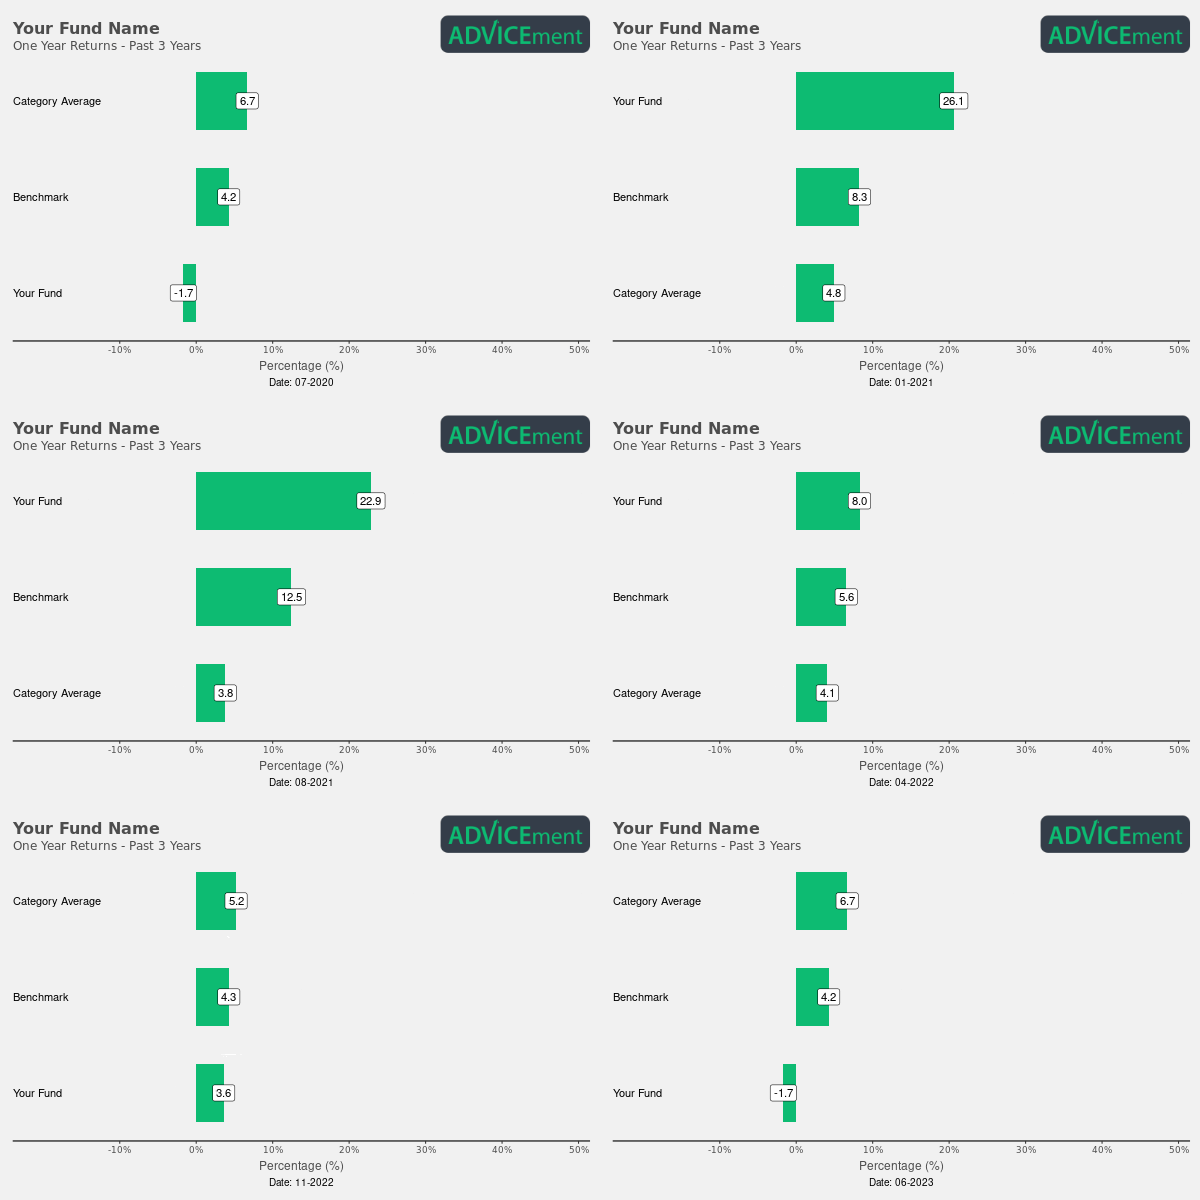
Animated Bar Charts: Dynamic Displays of Comparative Data

Step into the next generation of data visualization with our animated bar charts. No longer are comparisons static and flat. Watch as bars rise, adjust, and compete in a lively dance of numbers, offering an interactive and immersive experience that paints a clearer picture of data sets.

Whether you're juxtaposing monthly sales, yearly performance metrics, or any other comparative data, our animated bar charts transform the ordinary into the extraordinary. It's not just about presenting numbers; it's about creating an engaging narrative that allows for deeper insights and understanding at a glance.

Animated Bar Chart

How Does It Work?

Get in touch today and get animated charts in approximately 15 business days.

Initial Contact

Reach out to our dedicated team through our contact form. In this initial phase, we aim to understand your specific needs, the kind of data you're working with, and the goals you wish to achieve with animated charts.

Today
0 Days

Proof of Concept

Before diving into the full project, we believe in showcasing our capabilities. We'll take a sample of your data and create a preliminary animated chart, giving you a tangible glimpse of the final product. This stage ensures alignment in vision and sets clear expectations.

1st Week
+- 5 Business Days

Implementation

Once you're satisfied with the proof of concept, our team begins the full-scale creation of your animated charts. Using state-of-the-art tools and drawing from years of expertise, we craft charts that not only represent your data accurately but do so with flair and precision.

3rd Week
+- 15 Business Days

Animated Charts Within Two Business Day

We understand the importance of time in the business world. That's why we commit to delivering your animated charts within two business days post-implementation. Quick, efficient, and of the highest quality – that’s our promise to you.

Afterwards
1-2 Business Days

Why Create Animated Charts?


Enhanced Engagement & Retention

Data presented dynamically is more likely to captivate your audience. Animated charts grab attention, ensuring that your message doesn't just reach your audience, but resonates and sticks with them. It’s not just about showcasing data; it's about making it memorable.


Simplified Complex Data Interpretation

Sometimes, numbers and statistics can be overwhelming. Animation breathes life into data, transforming complicated metrics into intuitive visuals. By guiding viewers through the data journey, animated charts simplify understanding, ensuring that intricate points are effortlessly grasped.

dashboard


Versatility Across Platforms

Animated charts are not limited to presentations or reports. They shine on digital platforms too – from websites to social media channels. In an era where digital presence is paramount, these charts can be shared, embedded, and featured across various platforms, maximizing visibility and outreach.


Competitive Differentiation

In a world where standard bar and line charts are the norms, animated charts set you apart. They demonstrate innovation, commitment to clarity, and a fresh approach to data presentation. For businesses and professionals, this differentiation can be a game-changer in establishing a unique brand identity.

Subscribe to Our Advicement Newsletter

We write about our technology, news and product releases in our newsletter.
Typically we will send you product updates and articles that appear on the Advicement blog.

Contact Us

We’re ready to customise a PDF generating solution for your business. Reach out to us and let’s save you time and money today!

By using this website, you accept our Terms of Service. This website is run by Advicement Investment Services (Pty) Ltd, a private company registered in Republic of South Africa (Enterprise #: 2013/122231/07).
All rights reserved.

© 2018 - 2024 Advicement Investment Services (Pty) Ltd
"Never send a human to do a machine's job." - Agent Smith, The Matrix