How to create great factsheets for your financial products
14 September 2018 Igor Rodionov
Have you recently launched a new financial product or are you busy updating your existing minimum disclosure document range? In this article, we explore what makes an excellent regular reporting document and the common mistakes that we see in existing reports.
Explanation is Key
Treating your factsheets as the first communication with a new potential investor is everything. Too many times we see documents that are cryptic and uninformative. Here are some helpful tips:
Ensure that your text has an introduction to your financial product for a new investor.
Include a paragraph that clearly explains who is suitable for this investment.
Show how your financial product is different from other products available in the market.
Ideally, you should provide this information in one or two concise paragraphs about your financial product. Try putting yourself in the shoes of a first-time investor to understand whether you have generated enough interest and caught the investor’s attention.
Consistency, Consistency, Consistency
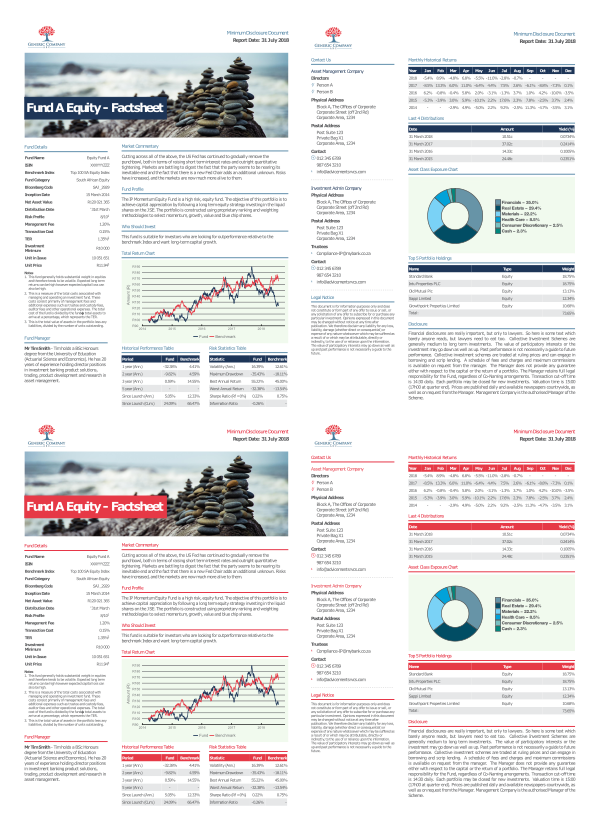
Too many times we've seen unprofessional factsheets with an inconsistent format, misaligned margins and MS Word standard fonts. However, the reality is that many factsheets get created by merely pasting MS Excel charts, manually updating financial statistics and then saving the file as a PDF. This process can shift the existing layout on a month to month basis, and as a result can lose document quality. Consistent formatting throughout the document will give a professional first impression and align the right attributes to your brand. To get this right, you need to use the right tools for the job.
Unfortunately creating a PDF from MS Excel will not achieve the required results. This is because it is almost impossible to align the cells effectively throughout the document. Sending the material to a design team can solve these issues, but the downside is that this can increase your costs and significantly delay the process of generating and distributing the factsheets.
Visual Representations of Data
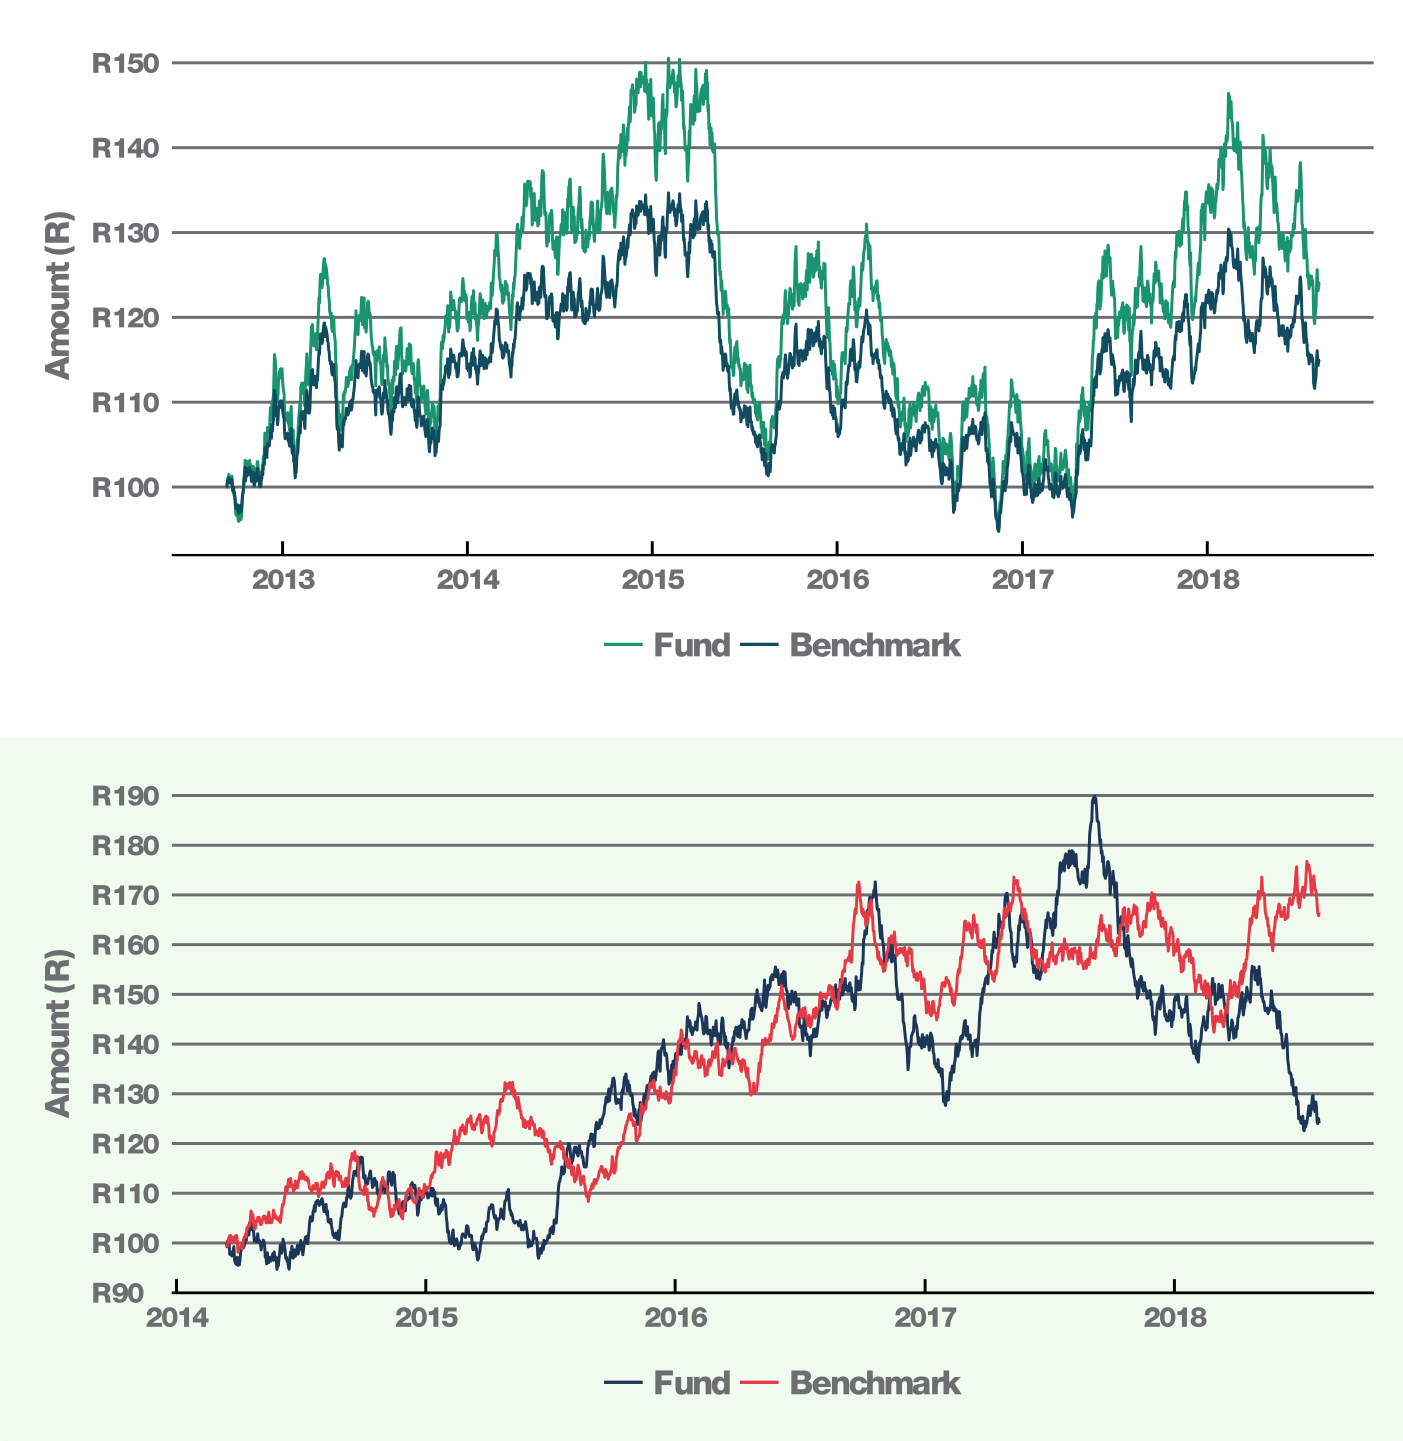
We have often seen factsheets packed with tables of return and risk statistics for every possible period imaginable. Unfortunately, investors quickly lose interest in this approach, and information overload can be detrimental to the success of your financial product. We recommend showing the most common statistics in the table format for comparison purposes, but more importantly visualising the data with charts. Graphics that summarise large amounts of information concisely and effectively are essential to creating successful factsheets. Furthermore, effective use of graphics improves the readability of the document and will catch the reader's attention.
Your Branding, Logo and Design
Making sure that your branding is adequately represented in the factsheet is crucial to differentiating yourself from other product providers. Using an appropriately sized logo and a consistent colour scheme remains to be an afterthought for many financial institutions. Financial reporting, minimum disclosure documents and product factsheets are among the first pieces of information that your clients notice about your company. Make sure that you consistently represent your brand to ensure your financial product's success.
Our Offering
Advicement Services is a South African based company that utilises technology and automates the creation of factsheets and minimum disclosure documents. Our technology solution solves the issues mentioned above, while saving clients time and improving the turnaround time of the documents. Our approach is to first create a proof of concept that can demonstrate the value created through outsourcing of this process to us. Please do not hesitate to get in touch with us to see how we can improve your factsheets and processes.